What Drives Jumper Unity Values?
TL;DR
- Most important (permutation): End expansion (in-plane), pipe props (OD, WT), then geometry and system
- Ablation order of impact: end expansion » geometry ≈ pipe props » system » vertical movement ≈ tolerance » position
- Position matters modestly; linear ramp is closest to original in most cases
Why this study
Given that the model works, the next question is “why?” This article walks through a deep‑dive feature‑importance study for our ML model that predicts per‑element unity along jumper structures. The goal isn’t just a ranking; it’s intuitive, engineering‑useful guidance on which inputs the model relies on—and by how much.
Along the way, we call out pitfalls (notably a normalization mismatch), explain our methodology choices to keep the analysis physically meaningful, and discuss how the results should inform design, data QA, and model use.
The setup: what the model sees
- An segment‑type embedding (Straight/Bend)
- A repeated vector of 32 global parameters (geometry, system, pipe properties, etc.)
- A positional scalar in [0, 1]
Training standardized all 32 global inputs using the dataset mean/std. For this study, we applied the exact same normalization before inference.
Baseline performance and configuration
- Model: UnityBiLSTM (5 layers, hidden=256, embed=16, bidirectional, dropout=0.2)
- Baseline masked MSE: 9.7936e‑05
- Batch size: 32 • Permutation repeats: 3 • Positional samples: 50
- All metrics are masked MSE computed only on valid (unpadded) elements
Results
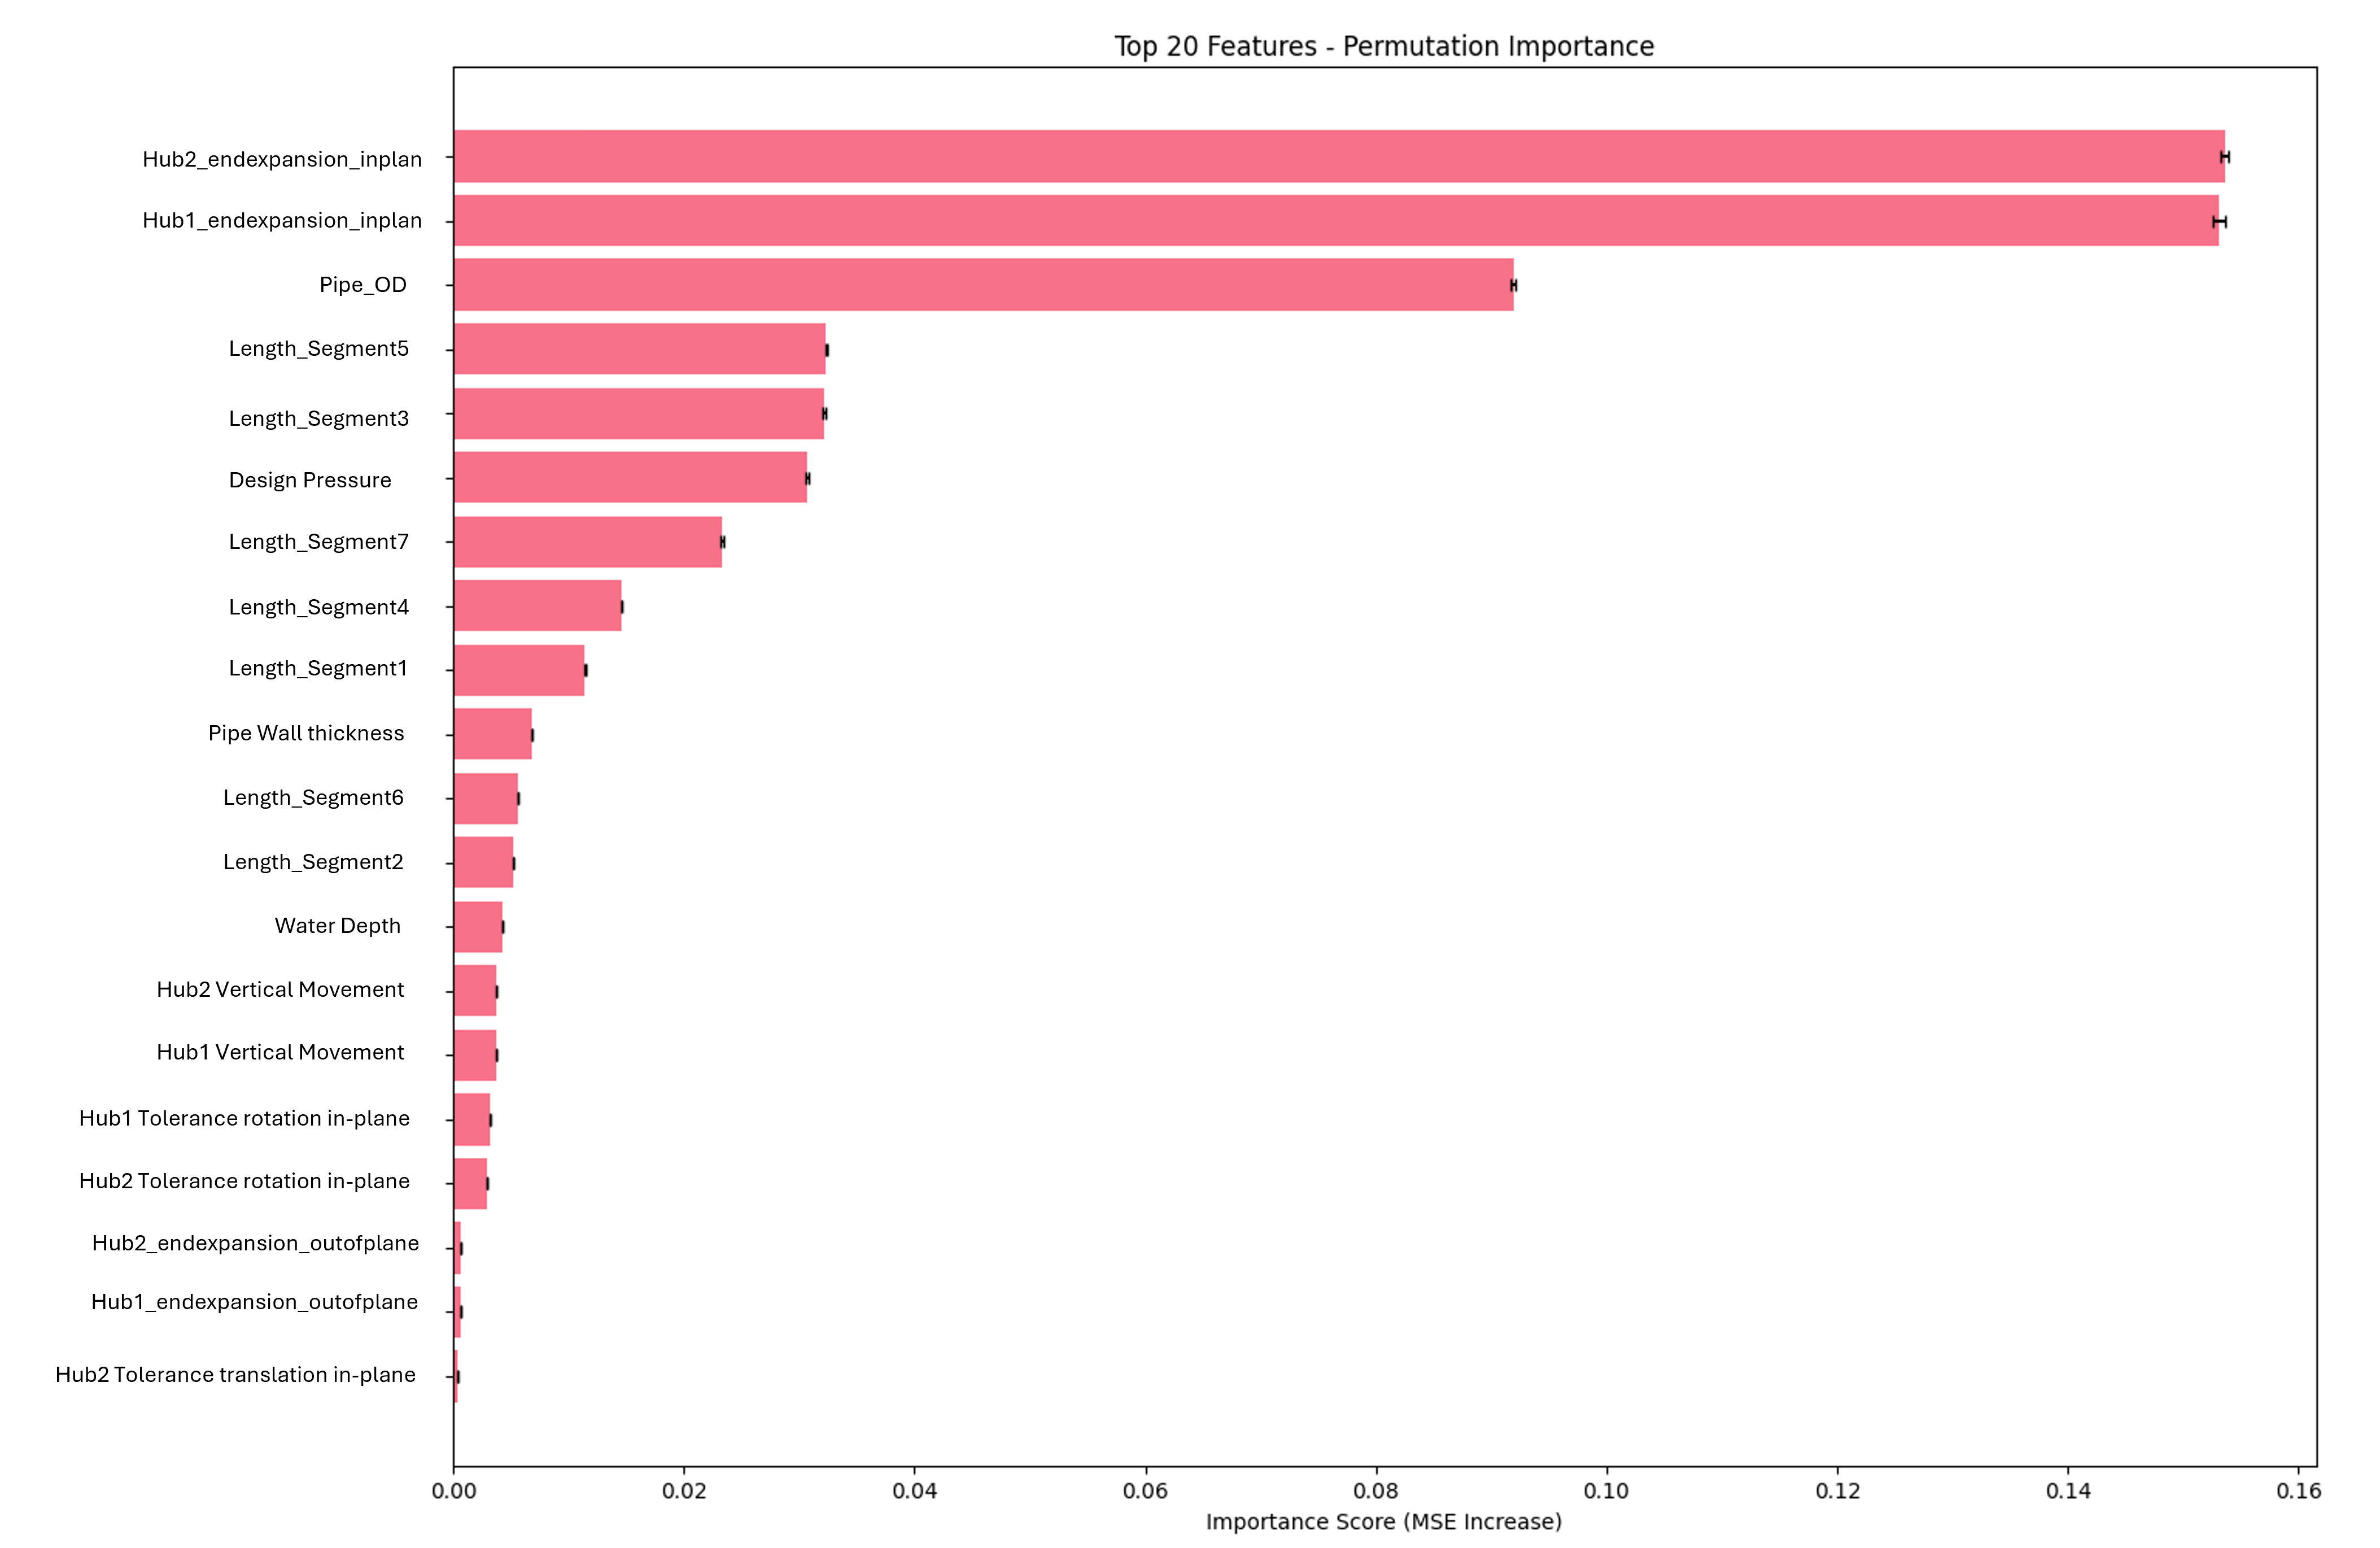
1) What moved the needle most (permutation importance)
Scrambling a single global parameter reveals two standouts: end expansion and pipe properties. Both dwarf other features, with geometry and certain system inputs following.
| Feature | ΔMSE (mean) | ΔMSE (std) |
|---|---|---|
| Hub2 EndExpansion (in-plane) | 0.153593 | 0.000289 |
| Hub1 EndExpansion (in-plane) | 0.153082 | 0.000563 |
| Pipe Outer Diameter | 0.091933 | 0.000227 |
| Segment 5 Length | 0.032337 | 0.000076 |
| Segment 3 Length | 0.032159 | 0.000114 |
| Design Pressure | 0.030700 | 0.000108 |
| Segment 7 Length | 0.023322 | 0.000147 |
| Segment 4 Length | 0.014615 | 0.000060 |
| Segment 1 Length | 0.011438 | 0.000077 |
| Pipe Wall Thickness | 0.006889 | 0.000010 |
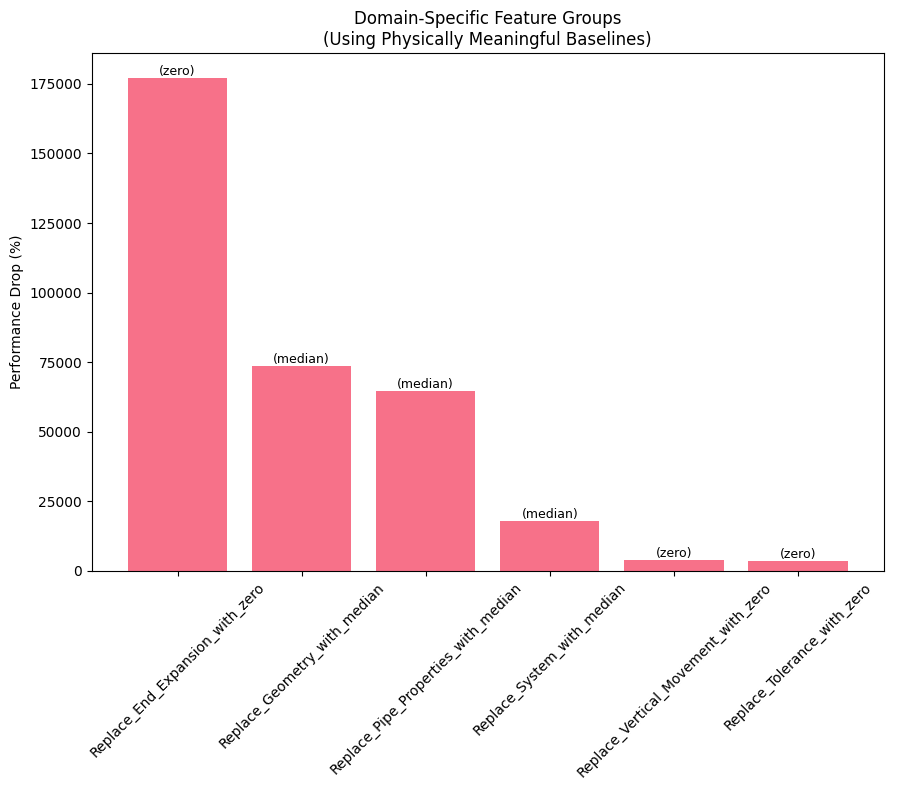
2) What happens when we remove whole groups (ablation)
Here we group the features into 6 groups: End expansion, Geometry, Pipe properties, System, Vertical movement, and Tolerance. We then remove each group (either zeroing or median the values) and measure the performance drop. Permutation isolates marginal effect; ablation asks “what if this entire set were typical or idealized?” We apply physically meaningful baselines and measure the performance drop.
| Group (baseline) | New MSE | ΔMSE | Δ% |
|---|---|---|---|
| End expansion (zero) | 0.173657 | 0.173559 | 177,216.32% |
| Geometry (median) | 0.072111 | 0.072013 | 73,530.14% |
| Pipe properties (median) | 0.063547 | 0.063449 | 64,786.20% |
| System (median) | 0.017550 | 0.017452 | 17,819.70% |
| Vertical movement (zero) | 0.003808 | 0.003710 | 3,788.44% |
| Tolerance (zero) | 0.003468 | 0.003370 | 3,441.00% |
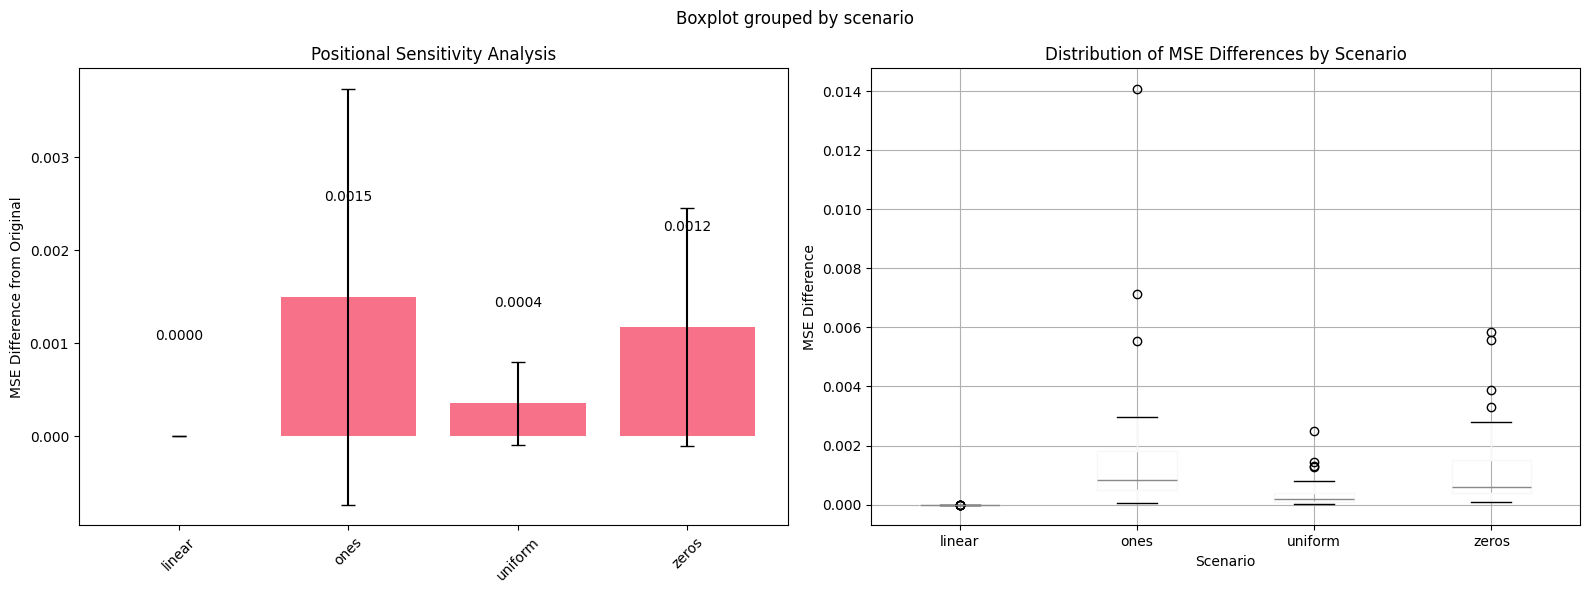
3) Does position matter?
We also tested the effect of position on the model. The position of each element is encoded from 0(Hub1) to 1(Hub2), and we tested the effect of zeroing, ones, and linear ramp. We found that the model is not very sensitive to position, and the linear ramp is the closest to the original in most cases.
- uniform(0.5): small but consistent increases (~1e‑4 to 7e‑4 typical)
- zeros/ones: larger increases (~1e‑4 to 2e‑3)
- linear(0→1): negligible change (~1e‑8 to 1e‑7) and typically closest to original
What this means in practice
- Integrity management and end expasion monitoring is crucial in ops(operations).
- In design phase, prioritizing fidelity for end‑expansion inputs; small errors cause very large degradations.
- Control OD/WT, set explicit min wall and corrosion allowance; ensure OD/WT tolerances used in analysis match fabrication specs.
- Use group ablation ordering to guide data QA and instrumentation priorities.